Anyone with even a basic exposure to the financial world will have at some point come across the term “EBITDA.” Despite not being officially recognized under GAAP, EBITDA (earnings before interest, tax, depreciation, and amortization) is one of the most widely used metrics in finance, particularly when it comes to valuation analysis and securities pricing analysis. By stripping away “non operational” expenses, EBITDA in theory allows for a cleaner analysis of the intrinsic profitability of a company. Since then, it has become so widespread that public companies have even begun reporting it in their earnings filings.
Given its extensive use, it may come as a surprise that EBITDA has several important critics. In fact, luminaries from the investment world such as Charlie Munger and Seth Klarman have publicly expressed strong reservations about its use. Perhaps the most stinging critique comes from the “Sage of Omaha,” Warren Buffett himself. “When CEOs tout EBITDA as a valuation guide, wire them up for a polygraph test.” he proclaims. In Berkshire Hathaway’s 2000 shareholder letter, he went so far as to say, “When Charlie and I read reports… references to EBITDA make us shudder — does management think the tooth fairy pays for capital expenditures? We’re very suspicious of accounting methodology that is vague or unclear, since too often that means management wishes to hide something.”
The stinging criticism from such well-known investors may be unexpected to many readers. This article thus dives into the main reasons why EBITDA receives disapproval and looks at whether arguments in favor of curbing its popularity are merited.
The strongest argument in favor of using EBITDA is that it provides a clean metric of profitability without the impact of accounting policies, capital structure and taxation regimes. It exclusively focuses on operating expenses, including the cost of services/goods sold, sales and marketing expenses, research and development, and general and administrative expenses. In summary, EBITDA is supposed to reflect the pure operating performance of any company.
Stripping out non-operating expenses can be useful for several reasons. For instance, in an M&A process, if the acquiring company would look to refinance the capital structure of the target company and change the capital expenditure plans, then it would want to use EBITDA to get an idea of what the earnings of the target entity would look like once the merger is executed. As Adams Price, managing director at The Forbes M&A Group, says, “[EBITDA serves as] a proxy for pre-tax operational cash flow. It gives a sense of what cash flows might be expected to come out of the business after an M&A transaction.”
Another reason for using EBITDA is that when comparing similar companies in different parts of the world, the effects of the different taxation and accounting systems can often muddy the waters. Tom Russo of Gardner Russo & Gardner delves into this: “It’s one thing to say in a U.S. context that you’ve looked at pre-tax earnings rather than EBITDA. But when you start to look at Heineken versus Cadbury Schweppes versus Budweiser, and if you don’t adjust for those non-cash charges — and one way to do it is using EBITDA — you have a more difficult time comparing across the market.”
With the above in mind, it would seems that EBITDA is an extremely useful metric. But then why the criticism? Most of the arguments against using EBITDA come down to the following fundamental question: does excluding interest, tax, depreciation and amortization really provide a “truer” picture of the operating performance of a company? Let’s look at this in more detail.
Depreciation and Amortization
Working backwards, the first line items excluded from EBITDA are depreciation and amortization. Doing so makes sense in many cases. Depreciation and amortization are in fact non-cash expenses. So much so that the depreciation expense included in the income statement could be related to an expenditure incurred years ago. In fact, there are multiple ways with which to account for depreciation and amortization, and one’s choice of which method to use will have a significant impact on the reported earnings of a company.
As Karen Berman and Joe Knight put it: “Depreciation and amortization are unique expenses. First, they are non-cash expenses — they are expenses related to assets that have already been purchased, so no cash is changing hands. Second, they are expenses that are subject to judgment or estimates — the charges are based on how long the underlying assets are projected to last, and are adjusted based on experience, projections, or, as some would argue, fraud.” That’s why excluding depreciation and amortization can in theory paint a more realistic picture of true operational performance.
However, is this always the case? Some argue not. For companies in capital-intensive sectors like telecoms, for instance, depreciation and amortization are two of the major expenses and can’t be ignored as they’re capital expenditure form a major chunk of the cash outflow. Capex in the form of towers and network equipment are real expenses and depreciation and amortization are the annual charges the business is taking through its income statement. Another industry where using EBITDA could be misleading is the shipping industry — again a very capital intensive sector.
The fact that capex in some industries is intrinsically an operational expense and therefore should not be ignored is summarized nicely by Professor Chris Higson of London Business School:
“Used with care, EBITDA can be a useful way of isolating a certain subset of costs when comparing a group of similar companies. But too often it tends to be justified with the argument that, by omitting depreciation and amortisation, EBITDA represents a better measure of profit, one that better approximates cash flow. This is nonsense. Depreciation is a very real cost. It is the cost of consuming productive capacity. For some capital-intensive companies, depreciation is the largest cost they have. If we omit depreciation, we are not measuring income.”
Let’s look at a real world example: Sprint Corp, a telecommunication services provider. If we just take EBITDA to analyze the results of Sprint Corp in 2015-2017, we might conclude that it’s a great business with history of making large profits year after year (Table 1).
Table 1: Sprint Corporate EBITDA Summary
| Year ending Mar. 31, $ millions |
2015 |
2016 |
| Revenues |
34,532 |
32,180 |
| Cost of Services and Products |
(18,969) |
(15,234) |
| SG&A and Other Operating Expenses |
(12,109) |
(9,548) |
| EBITDA |
3,454 |
7,398 |
Source: Company filings
However, if we go further down the income statement and look at earnings before interest and taxes (EBIT) and therefore take into account the effect of depreciation and amortization, we arrive at a completely different conclusion. In fact, Sprint hardly seems to be making any money in the business, whereas its EBITDA runs into billions of dollars.
Table 2: Sprint Corp Detailed Financials
| Year ending Mar. 31, $ millions |
2015 |
2016 |
| EBITDA |
3,454 |
7,398 |
| Depreciation and amortization |
(5,349) |
(7,088) |
| EBIT |
(1,895) |
310 |
Source: Company filings
Let’s look at another example: Liberty Global, an international telecommunications and television company. Below is a look at Liberty Global’s depreciation expense in comparison to its revenues. D&A expenses form c. 30% of the revenues! Clearly, this is not a cost that can be ignored when analyzing the company’s profitability.
Table 3: Liberty Global Depreciation Table
| Year ending Dec. 31, $ millions |
2013 |
2014 |
2015 |
2016 |
| Revenues |
144,74 |
18,248 |
18,280 |
20,009 |
| D&A |
4,276 |
5,500 |
5,826 |
5,801 |
| D&A (as a % of Revenues) |
29.5% |
30.1% |
31.9% |
29.0% |
| Capex |
2,482 |
2,684 |
2,500 |
2,644 |
| Capex (as a % of Revenues) |
17.1% |
14.7% |
13.7% |
13.2% |
Source: Company filings
Interest Expense
The second key line item that EBITDA excludes is interest expense. The logic for doing so is that in order to get to a better picture of operational profitability, interest expense should be excluded given that it depends on the capital structure — i.e., the mix of debt and equity used to finance the business.
But, again, the question should be: Does excluding the effects of a company’s capital structure really provide a truer picture of operational performance? No matter how small a business is, it is very common to use some amount of debt to finance the business. In capital-intensive industries including steel, oil and gas, and telecom, one would find debt amounting to tens of billions of dollars on a company’s balance sheet.
Consider US Steel, America’s leading steel producer, which generated approximately $1 billion EBITDA in 2011, but had operating cash flows of only $150 million in the same year. Depreciation and amortization expenses were about $700 million and interest expense was to the tune of $200 million in 2011. Given the nature of the business with regular capital expenditures on plants and machinery to maintain and expand operations, US Steel funded a meaningful portion of its approximately $850 million capital expenditure in 2011 through debt and related instruments.
With this in mind, wouldn’t we consider interest expense an almost operational part of the business? Focusing only on EBITDA and ignoring interest expense would provide an incomplete analysis from a business perspective, especially when US Steel repeatedly funds necessary equipment maintenance and renewal through debt. By the way, as a result of depreciation and interest expenses, US Steel posted a loss in 2011 and EBITDA comprehensively failed to provide the whole picture.
Warren Buffett agrees, and in 2002, for instance, said that “people who use EBITDA are either trying to con you or they’re conning themselves. Telecoms, for example, spend every dime that’s coming in. Interest and taxes are real costs”
In the spirit of Buffett’s comment, let’s look at another real-world example from the telecom industry: Charter Communications (a cable and broadband services provider). We’ve already established above that capital expenditures are a necessary part of any telecom’s business operations. Importantly, Charter Communications funds its capital expenditure through debt. Logically, interest expense is thus a quasi-operational expense and cannot be ignored. With one bad year in 2008 where the business didn’t operate efficiently, it had to file for bankruptcy despite maintaining positive EBITDA.
Table 4: Charter Communications Financials
| Year ending Dec. 31, $ millions |
2005 |
2006 |
2007 |
2008 |
| Revenues |
5,033 |
5,504 |
6,002 |
6,479 |
| EBITDA |
1,747 |
1,721 |
1,876 |
696 |
| EBITDA Margin (%) |
34.7% |
31.3% |
31.3% |
10.7% |
| Interest Expense |
(1,818) |
(1,877) |
(1,851) |
(1,903) |
| Interest as a % of EBITDA (%) |
104.1% |
109.1% |
98.7% |
273.4% |
| Net Profit |
(1,003) |
(1,586) |
(1,616) |
(2,451) |
Source: Company filings
Taxation Expense
The last line item that EBITDA strips out is tax expense. Again, there could be good reasons to do so. Private equity funds, for instance, rely heavily on using EBITDA when evaluating businesses because it strips out the effect of taxation. The reason being that private equity buyers typically take on a large amount of debt to fund the acquisition, which reduces the equity capital they need to infuse to acquire the business. As a result, it leaves very little in taxable income after interest expenses have been paid to lenders. Minimal tax outgo is one of the reasons PE buyers are focused on EBITDA. It makes sense for PE, but PE owns just a tiny fraction of businesses all over the world. Putting aside the case of PE, over the last couple of years, tax inversion deals where companies were reincorporating outside the US to take advantage of lower tax rates in other countries were fairly popular.
However, just as with depreciation and amortization and interest expenses, there are certain cases where stripping out tax expense does not provide a better picture of true operating performance. Consider a US defense contractor. There are several restrictions on the domicile of service provider and, in some cases, the contracts are restricted exclusively for US incorporated businesses and, hence, the company would be subject to federal and state tax laws if it has to continue to do business with the department of defense.
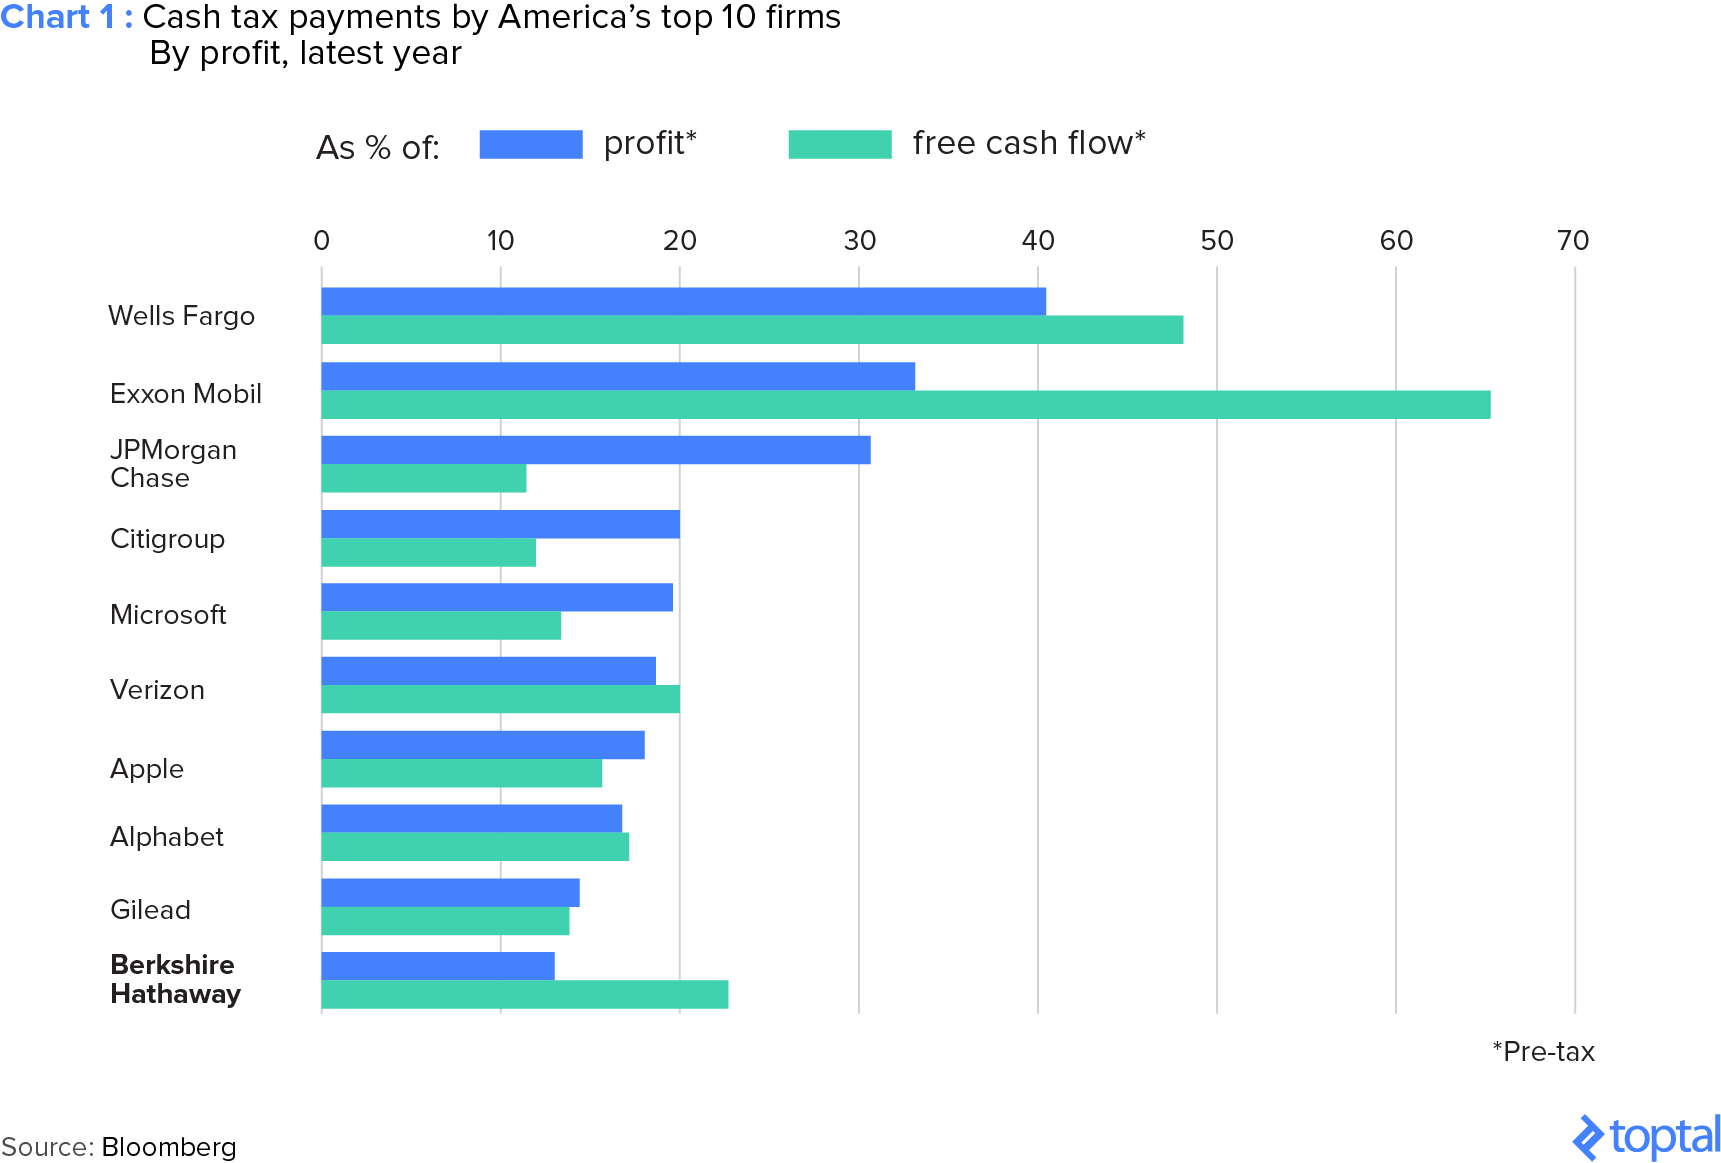
Though taxes are and will continue to remain a critical aspect while evaluating a business, it’s not a straightforward analysis given the complexity of the topic. Consider many large US-headquartered international companies and you will find a large difference between applicable tax rates and cash tax payments. The difference is not only due to these companies holding cash in international jurisdictions (e.g., Ireland where taxes are lower than the US), but research and development credits, carry-forward losses, operating leases, lower tax rates on capital gains and other exemptions allowed under the tax code add up to make a significant difference between applicable tax rates and actual cash tax payments by the business. This also make a standardized approach to taxes difficult to implement and EBITDA takes the shortcut and very conveniently skips all of this.
The Emperor’s New Clothes
EBITDA was conceived of as a way to more clearly measure operational performance of a company by excluding expenses that can obscure the true performance of the business. However, as we have seen above, EBITDA can often achieve the opposite result. In some industries, the very expenses that EBITDA ignores are in fact operational expenses required in the day-to-day operations of the company.
Perhaps the most well-known example of the perils of using EBITDA relates to WorldCom. In the early 2000s, WorldCom was the second-largest long-distance telephone company in the US and the world’s largest carrier of internet traffic. But in 2002, the world shook as the company filed for what was at the time the largest bankruptcy filing in US history, and it was later revealed that several accounting malpractices had inflated the company’s total assets by around $11 billion.
Specifically, the WorldCom accounting scandals revealed the extent to which manipulation of EBITDA could be achieved. The often questionable nature of the metric which had for many years either been ignored or misunderstood was suddenly thrown into the limelight. As Daniel Gross of Slate recounted:
“[With EBITDA], it was thought, companies couldn’t mess with that number. Chief financial officers could routinely manage earnings by using the tremendous leeway that existed to account for certain items or take various charges. But EBITDA had far fewer moving parts, and there was far less discretion in accounting for items like operating expenses and revenues. And that’s why investors continued to trust in the validity of EBITDA numbers put out by companies like WorldCom, Qwest, and Global Crossing, even as their debts mounted and sales didn’t meet expectations. In admitting that it had manipulated its EBITDA, WorldCom pinned the blame squarely on Chief Financial Officer Scott Sullivan, who was fired coincident with the company’s confession. Here’s how Sullivan is supposed to be responsible. In 2001 and part of 2002, the company, presumably under the direction of Sullivan, took $3.8 billion in costs related to building out its systems, which were usually filed as “line cost expenses,” and treated them instead as capital expenses. Remember, something that’s a capital expense—say the construction of a plant—creates an asset whose value can be depreciated over time. More significantly, it doesn’t count in the figures used in calculating EBITDA. By improperly recharacterizing those expenses—the maneuvers were done contrary to accepted accounting practices—WorldCom made it seem as if its EBITDA was $3.8 billion greater than it really was. This charade went on for five quarters, apparently undetected by WorldCom’s hapless accountant, Arthur Andersen.”
A Good Cash Flow Proxy?
The other commonly touted reason for using EBITDA is that it’s a good cash flow proxy. This is particularly true for small businesses where most of the business is done on a cash basis and both revenues and operating expenses in the financial statements represent an almost complete picture of the business during a particular year. Think about standalone retail stores, restaurants and even small B2B/B2C service providers with a short history of operations behind them. EBITDA in a particular year would approximate cash flows for the business reasonably accurately and these cash flows could then be used for capital expenditures, interest and taxes, as the case may be.
Take the case of La-Z-Boy, the eponymous recliner company. In 2017, it was able to convert over 90% of its EBITDA into operating cash flows lending credence to the argument that EBITDA is a good proxy for cash flows. Nevertheless, if we go back to the 2015 and 2016 results of La-Z-Boy, it was able to convert a significantly lesser amount of EBITDA to its operating cash flows.
Table 5: La-Z-Boy Financials
| Year ending Apr. 30, $m |
2015 |
2016 |
2017 |
| Revenues |
1,425 |
1,525 |
1,520 |
| EBITDA |
125 |
149 |
160 |
| EBITDA Margin (%) |
8.8% |
9.8% |
10.5% |
| Operating Cash Flows |
87 |
112 |
146 |
| Operating Cash Flows as a % of EBITDA (%) |
69.2% |
75.5% |
91.5% |
Source: Company filings
Chris Higson of London Business School elaborates on this point:
“There is a view on the street as follows: ‘Cash flow measures are reliable because, unlike profit measures, they are not vulnerable to accounting. After all, taking the raw transactional data and pushing it around between periods using judgments about accruals is what accountants do. The cash flow statement simply undoes these accruals.’ A popular version of this view then says, ‘Depreciation and amortisation are pretty soft accounting numbers, so let’s add them and other long-term accruals back to EBIT to give us EBITDA, a hard number that will proxy cash flow.’ Unfortunately, the general view that cash flow is robust to accounting choices is, at best, only partly true and the specific view about EBITDA is wrong. Accrual accounting gets reversed at different points through the cash flow statement so, in general, cash flow statements get more robust to the effects of accounting policy choice the further down the page you go. For example, revenue anticipation is reversed in working capital investment, cost capitalisation is reversed in capex. EBITDA is at the top of the cash flow statement and it is the cash flow measure that is most vulnerable to accounting. Analysts developed an increasing enthusiasm for EBITDA in the late nineties, so flattering EBITDA became an easy option for a company in financial difficulties such as WorldCom.”
As Dr. Higson described above, the fact that EBITDA sits at the top of the cash flow statement by definition means that significant cash flow expenses are not included in its calculation. Businesses with high working capital requirements for instance would not see the effects of this reflected in their EBITDA figures. Using EBITDA as a proxy for cash flow is therefore highly questionable.
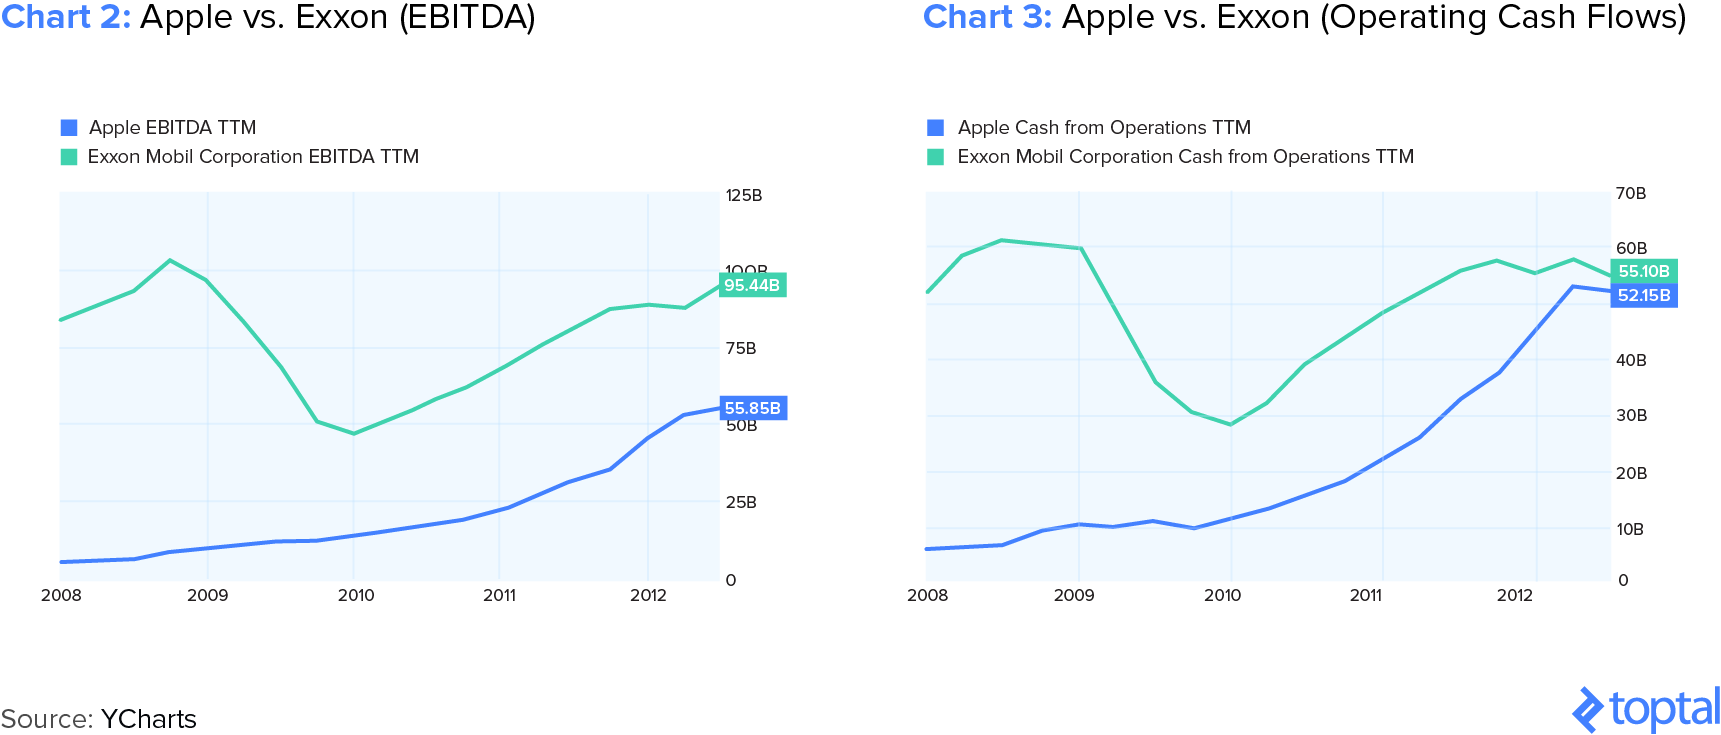
In another example, let’s look at EBITDA and operating cash flows for Apple and Exxon. Not only is there a difference between EBITDA and operating cash flows for these businesses individually, there is a huge gap between the EBITDA of these companies ($56 billion vs. $95 billion) and the cash flow from operations ($52 billion vs. $55 billion), which are almost equal in June 2012. Moreover, the gap between EBITDA and operating cash flows for these businesses has been narrowing for a while which EBITDA fails to capture.
Returning to our previous example of Sprint, if we compare the EBITDA numbers with the free cash flow numbers, we can again see a hugely different picture.
Table 6: Sprint Corporate EBITDA Summary
| Year ending Mar. 31, $ millions |
2015 |
2016 |
| Revenues |
34,352 |
32,180 |
| Cost of Services and Products |
(18,969) |
(15,234) |
| SG&A and Other Operating Expenses |
(12,109) |
(9,548) |
| EBITDA |
3,454 |
7,398 |
Source: Company filings, YCharts
Table 7: Sprint Corporate Free Cash Flow
| Year ending Mar. 31, $ millions |
2015 |
2016 |
| EBIT |
(1,895) |
310 |
| Income Tax (expense) benefit |
574 |
(141) |
| Depreciation & Amortization |
5,349 |
7,088 |
| Capex |
(6,167) |
(7,070) |
| Changes in Working Capital |
(1,935) |
(2,713) |
| Free Cash Flow |
(4,074) |
(2,526) |
Source: Company filings, YCharts
Considering the above, we can conclude that although Sprint looked like a good business at the EBITDA level, it becomes a highly unsustainable business when we look at other profitability metrics such as EBIT, net income, and free cash flows — so much so that Sprint is currently on the verge of bankruptcy with c. $34 billion in debt.
EBITDA as a Valuation Metric
EBITDA is the most commonly used metric for valuation purposes. You can pick virtually any M&A announcement across any sector (with the exception of the financial services industry) and would find the mention of EBITDA as an underlying valuation metric for the business. In addition, all the transactions are evaluated largely on EBITDA basis.
“Restaurant Brands International would be paying top dollar to acquire Popeyes raised some eyebrows. At 21x EBITDA, the $1.8 billion transaction had the highest transaction multiple ever paid for a U.S. restaurant company. By comparison, when 3G acquired Burger King in 2010, the valuation was at 9x EV/EBITDA.”
“The EV paid by Air Liquide of $13.4 billion represents an EBITDA multiple of 14.4x, based on the adjusted EBITDA figure reported by Airgas in 2014 (c. $930 million), way higher than the 8.8x multiple that Air Products would have paid on Airgas’ 2010 adjusted EBITDA (c. $660 million).”
Qualcomm bought NXP Semiconductors for $38.5 billion and including the assumption of debt, the deal is worth $47 billion. NXP Semiconductors is valued at EV/EBITDA of 14.6x and EV/Revenues of 3.8x.
Seth Klarman has again called into question EBITDA’s use as a valuation metric. He believes that EBITDA might have been used as a valuation tool because no other valuation method could have justified the high takeover prices prevalent at the time (1980s). According to him, EBITDA overstates cash flow as it does not take into account all the non-cash gains and expenses along with working capital changes.
A research paper on valuation analysis at the University of Oxford highlights the example of Twitter. In 2014, Twitter posted Adjusted EBITDA of ~$300 million and was valued at more than 40x EV / Adjusted EBITDA. Even though this valuation looked expensive, we could still convince ourselves of this valuation given high growth in revenues (more than 100% year on year) at that point in time — that’s exactly what Twitter did to investors.
But if you go further down the income statement or the cash flow metrics to triangulate your valuation using a couple of other methods, the picture changes considerably. Not only does the business not generate any earnings or cash flows, the definition of adjusted EBITDA used by Twitter is very questionable as it not only excludes depreciation and amortization, interest and taxes, but also stock-based compensation. And in fact, Twitter incurred more than $600 million in stock-based compensation expenses in 2014 — which was more than 40% of its 2014 revenues — but it asked potential investors to ignore that metric in order to arrive at its valuation.
Table 8: Twitter — Net Losses vs. Adjusted EBITDA
| Net Income |
FY2014$576 million |
| Add: Depreciation & Amortization |
208 |
| Add: Stock-based Compensation |
632 |
| Add: Other Income Statement Items |
40 |
| Adjusted EBITDA |
302 |
| Change Working Capital |
1,513 |
| Capital Expenditures, net |
224 |
| Repayment of Debt |
-0- |
| EV/EBITDA |
42x |
| Increase (Decrease) in Conv. Debt |
1.376 |
| Cash Flow Conversion Rate |
Negative |
| Price to Earnings |
Negative |
| Price to Free Cash Flow |
Negative |
Source: Oxford University
Alternative Valuation Methodologies
After considering the above, we find that EBITDA faces considerable challenges in its application as an underlying valuation metric, despite its immense popularity. Differences of opinion is also strongest here for Buffett, Munger and Klarman as they are looking to invest in businesses or buy them outright. Let’s follow their train of thought and visit some of the most common alternatives and apprise ourselves on their relative merits.
Table 9: Popular Valuation Methodologies
| |
Highlights |
Key Considerations |
| Enterprise Value (“EV“)/Sales or Price/Sales |
Used to value businesses with negative EBITDA and less susceptible to manipulation and accounting shenanigansCan be used to calculate both enterprise and equity value of the business |
Ignores profitability of the business which is the basis for valuationInaccurate in several cases, given the uncertainty on future profitability of loss making businesses |
| EV/EBITDA |
Earnings and cash flows proxy for businessesValues the enterprise independent of capital structure |
Doesn’t take into account taxes, depreciation expenses, and capital expenditures |
| EV/EBIT (Earnings Before Interest and Taxes) |
Earnings and cash flows proxy for businessesValues the enterprise independent of capital structure |
Doesn’t take into account taxes and capital expendituresDepreciation subject to accounting policies could be prone to manipulation |
| Price/Earnings |
One of the easiest metrics to value a businessDirectly calculates the equity value for the business |
Doesn’t accurately reflect the profitability of the businessProne to manipulation given the impact of one-off expenses, accounting policies, and taxes |
| Price/Book |
One of the easiest metrics to value a businessDirectly calculates the equity value for the business |
Doesn’t accurately reflect the profitability of the businessInfrequently used as a methodology in the current environment |
| Discounted Cash Flows (“DCF”) |
Most comprehensive method to value a businessCan be used to calculate both enterprise and equity value of the business |
Highly sensitive to terminal growth and cost of capital assumptionsInaccurate in most cases given the length of the projection period |
Source: Macabus, UBS
We can conclude from above that EBITDA is not the Holy Grail, even though it’s as good as, if not better than, as some of the popular alternatives mentioned. But all this begs the question: “If not EBITDA, then what?” Unfortunately, there is no straight answer, and we can see from above that all the metrics and methodologies have advantages and limitations. Most of the other popular valuation methodologies are fighting with similar issues as none of the methodologies, except for DCF, considers cash flows to the firm/equity owners (although DCF has its own set of issues with sensitivity to assumptions regarding the future of the firm).
Hence, the valuation methodology used would depend on the underlying business more than anything else. In addition, it could also depend on the type of buyer as well as the industry it operates in, among other things. Warren Buffett seems to have purchased See’s Candies and Nebraska Furniture Mart based on pre-tax earnings, as he was looking to add these to Berkshire Hathaway where taxes would be paid at the Berkshire Hathaway level rather than at these acquired businesses. In industries like steel or oil and gas, investors and acquirers look to EV/Capacity, i.e., mt/barrels for respective industries.
Should EBITDA Be Scrapped?
EBITDA is here to stay, given its immense utility as a key financial metric. Ease of calculation, communication and comparison gives it a lollapalooza effect, making its use self-perpetuating amongst financial analysts. However, the broader financial community needs to evolve from its current hedgehog mindset where they currently use EBITDA like a hammer and every business like a nail. We need to take a fox mindset and use EBITDA as one of the many tools to evaluate a business and become more aware of the nuances.
But with the above in mind, if EBITDA’s use should be reconsidered, what other metrics could we fall back on?
The answer according, to Warren Buffett, is owner earnings. A comprehensive explanation of Owner Earnings would require a separate article altogether, however simply put Owner Earnings are:
- (a) Reported Earnings, plus
- (b) depreciation, depletion, amortization and other non-cash charges, less
- (c) average annual amount of capital expenditures for plant and equipment for business to maintain its competitive position and unit volume.
You can see shades of EBITDA in this. Let’s try to calculate this metric for Time Warner Cable, which was acquired by Charter Communications in 2016.
Table 10: Time Warner Cable Owner Earnings
| Year ending Dec. 31, $ millions |
2014 |
2015 |
| Revenues |
22,812 |
23,697 |
| EBITDA |
8,228 |
8,138 |
| Net Income |
2,031 |
1,844 |
| Depreciation & Amortization |
3,371 |
3,696 |
| Other non-cash expenses |
797 |
542 |
| Total Capex |
(4,097) |
(4,446) |
| Maintenance Capex1 |
(2,480) |
(2,752) |
| Owner’s Earnings |
3,719 |
3,330 |
Source: Company filings1. Maintenance Capex figure is subjective in nature. For TWC, we have approximated maintenance capex by comparing company’s total capex with growth capex (# of new subscribers added * Consumer Premises Equipment capex for these subscribers)
In this example, EBITDA has remained fairly constant, but Owner’s Earnings have decreased by c. 10% YoY mainly due to the increase in maintenance capex in 2015. This metric can therefore provide a better view of the business earnings rather than EBITDA as it gives the real dollar amount an owner can withdraw from the business without affecting operations.
This informative article originally appeared on www.toptal.com and has been reproduced here with their permission.